DIY Investor Magazine
/
March 2016
35
Fig 1 – Portfolio Holdings Screen
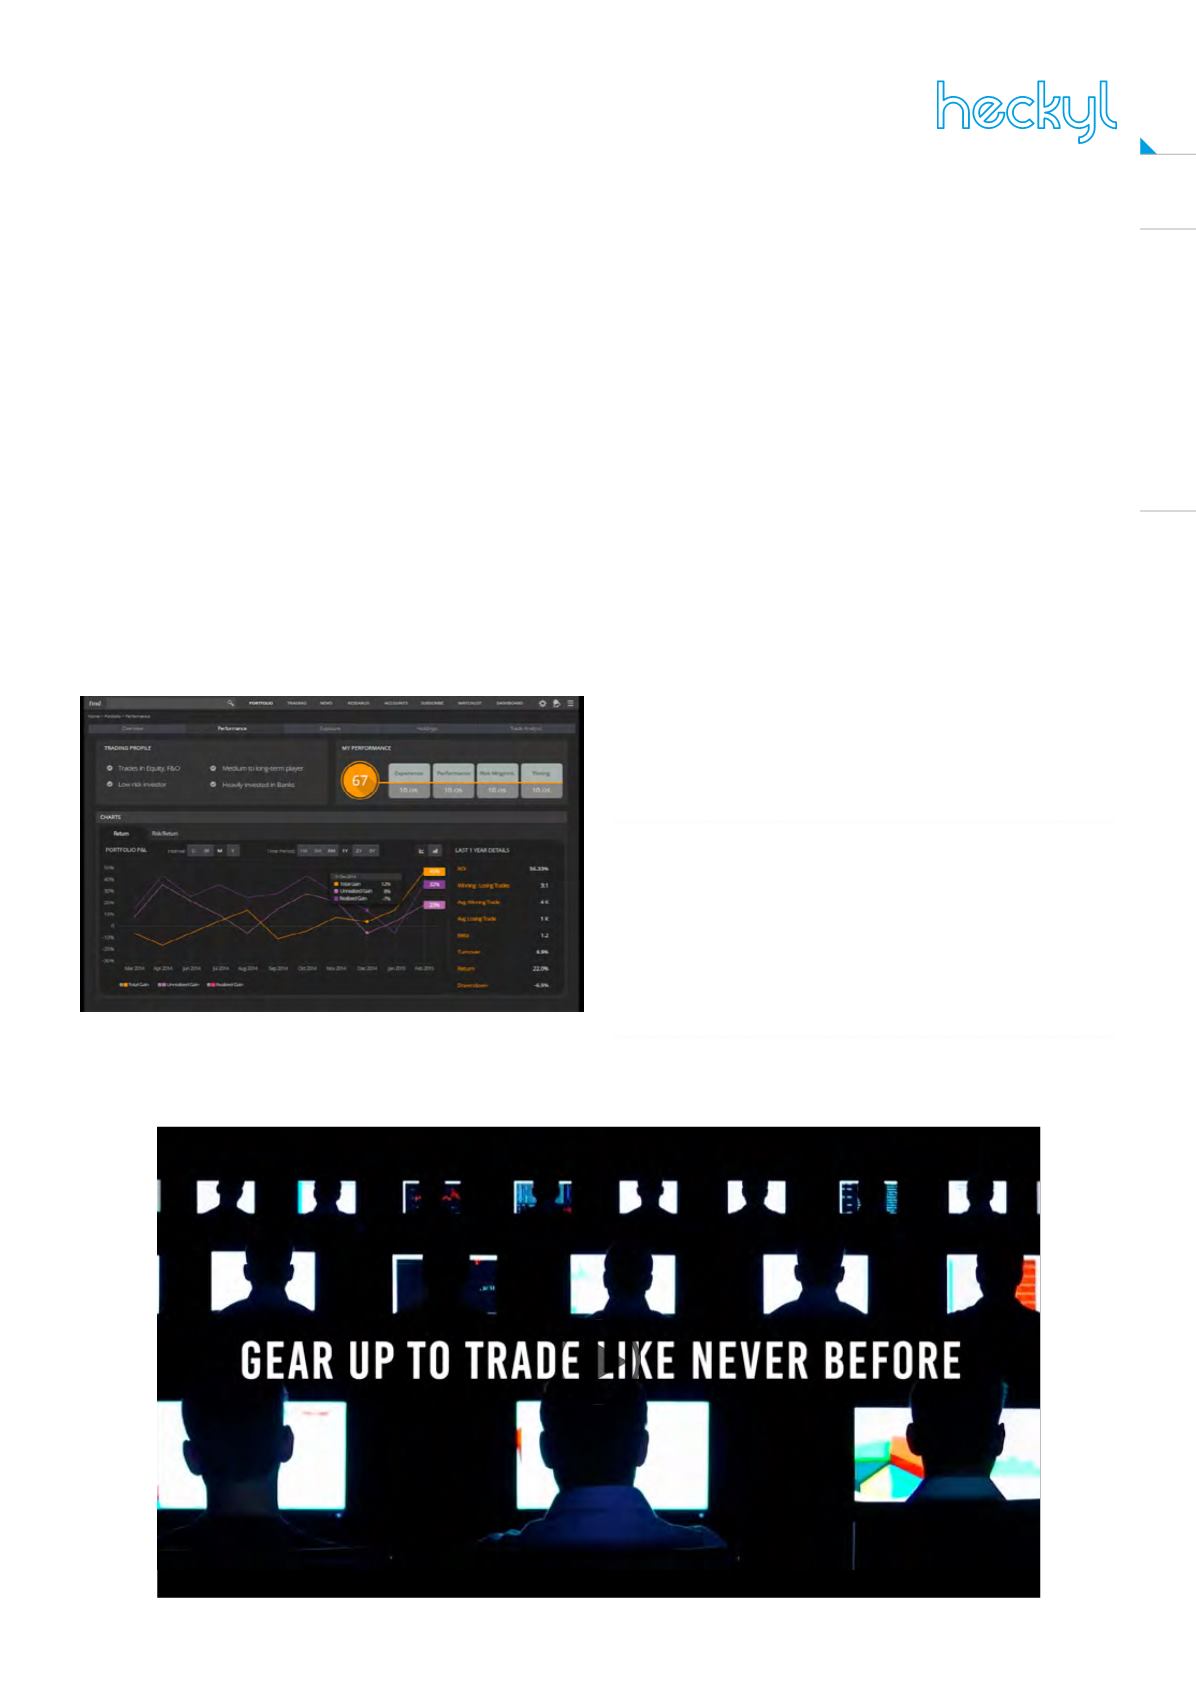
The trade analytics view allows a user to review their
trading behaviour, such as the most and least profitable
trades, which sector and market size investments have
been most effective. It also displays the best additions,
best exclusions, worst additions and the worst
exclusions to the portfolio.
This helps the user to find out their strengths, missed
opportunities and fine-tune entry and exit points for
trades, to help them find their best trading strategies.
In addition to this client view, Heckyl also provides its
brokers with a real-time dashboard of client behaviour
and trading statistics.
The vast sources of data available from the Internet are
hugely valuable, but the analysis and visualisation of
internal broker data is even more powerful, when done
effectively.
Here at Heckyl we believe that this is the future for
online research and trading platforms for retail brokers.
Presenting flat data is no longer sufficient to help users
navigate the world of trading, we are moving into a time
of smart analysis and actionable data.
The interpretation and presentation of the underlying
data is crucial for both brokers and their clients.
By educating the end user in how to be a better trader
brokers can help them become better investors, at the
same time helping their own business develop and
grow.
BY ANALYSING THE CLIENTS TRADING DETAILS
HECKYL IS ABLE TO BUILD UP A PROFILE OF
THE USER AND HELP THEM UNDERSTAND THEIR
STRENGTHS AND WEAKNESSES, WITH THE AIM OF
MAKING THEM A MORE PROFITABLE TRADER.
RELIANCE TECHNOLOGIES AND HECKYL BRING TICK TRADING TECHNOLOGY


