DIY Investor Magazine
/
March 2016
30
The UK Stock Market Almanac 2016
SELL IN MAY;
SEASONALITY EFFECTS & ANOMALIES
When we last looked
at the latest edition
of Stephen Eckett’s
fascinating reference
work we learned about
the January effect, how
markets behave in US
presidential election
years, and what an
‘average’ month looks
like on the stock market.
This month we delve further into this engaging and
curious guide to the financial year and consider vital
information for all investors and traders looking for the
little edge that could make a big difference.
SELL IN MAY
An update on the strongest – and strangest
seasonality effect in the market.
When we look at historic time series of asset prices the
frequencies we use tend to be day, week, month or
year. But new patterns of behaviour might be revealed
by using other time frames.
In this case we are going to split the year into two six
month periods:
1.
Winter period – 1st November – 30th April
2.
Summer period – 1st May – 31st October
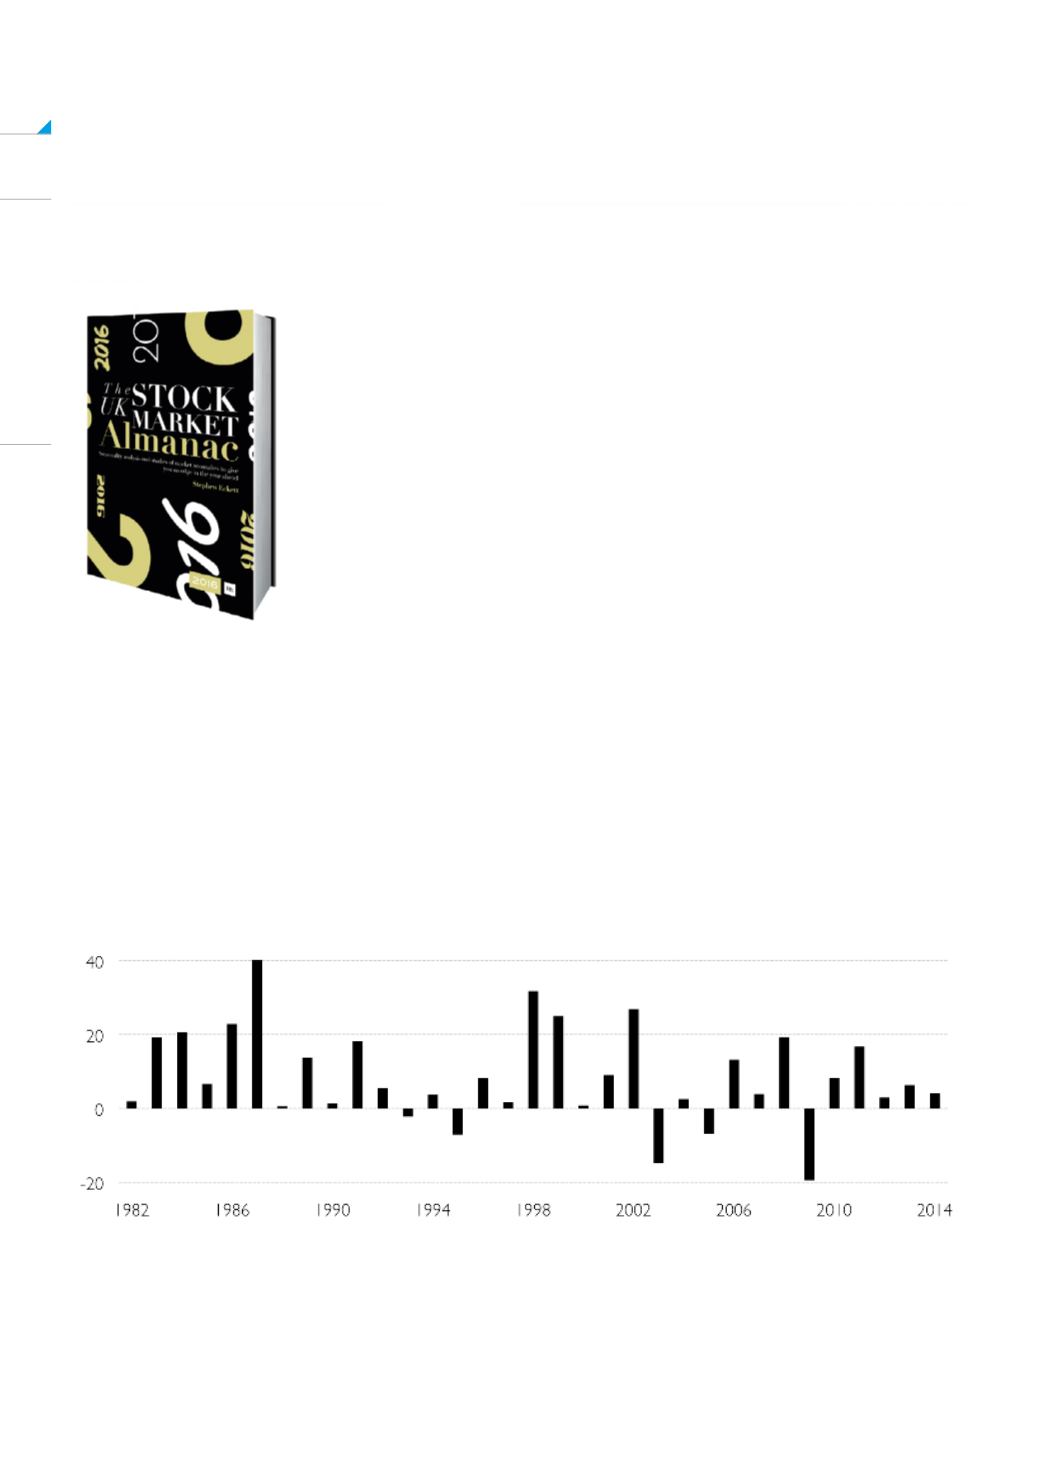
The following chart compares the performance from
1982 of the FTSE All-Share index for the next two
periods; each bar represents the out performance of
the winter period over the following summer period
For example, from 1st November 2013 to 30th April
2014 the index rose 1.0%, while during the following
period 1st May 2014 to 31st October 2014 the index fell
3.2%.
The difference in performance was therefore
4.2%, and that is the figure plotted on the chart for 2014
(the final bar in the chart).
The chart shows quite a remarkable thing, namely that
the market seems to perform much better in the six
month winter period than the summer period.
To quantify this outperformance:
•
In the 33 years since 1982, the winter period has
outperformed the summer period 28 times (84%).
•
The average annual outperformance since 1982
has been 8.6%!


