DIY Investor Magazine
/
March 2016
34
PORTFOLIO ANALYTICS
SHAPING THE NEXT GENERATION OF RETAIL TRADERS
By Gustav Pegers
Head of Sales
As a company Heckyl is known for its big data
capabilities finding, collecting, analysing and visualising
millions of data sources from around the world, to
provide actionable financial insight. This data can then
be provided to end users, such as retail traders to help
them make informed investment decisions.
However, valuable big data also resides within financial
institutions and if analysed and visualised in the right
way, can be even more powerful. This is the other side
of Heckyl’s approach - working with brokers to harness
the data they have internally, sometimes mixing it with
the external data we also collect.
The continued commoditisation of market data means
that retail traders can find share price and fundamental
data from a wide variety of sources. The challenge fac-
ing retail brokers in the UK market is differentiating their
platform and keeping clients engaged. Utilising some
of Heckyl’s external data sets such as sentiment and
twitter alerts is a good approach.
However there is a vast source of internal data that
Heckyl can help brokers analyse and visualise, to help
their end clients become better traders.
By analysing the clients trading details Heckyl is able to
build up a profile of the user and help them understand
their strengths and weaknesses, with the aim of making
them a more profitable trader.
Heckyl’s has recently deployed this new Portfolio
Analytics platform for a number of clients in India and
we believe it represents the next generation for trading
platforms. Deployed as a ‘black box’ within the broker’s
infrastructure, the system analyses a number of key
parameters to provide a 360-degree view.
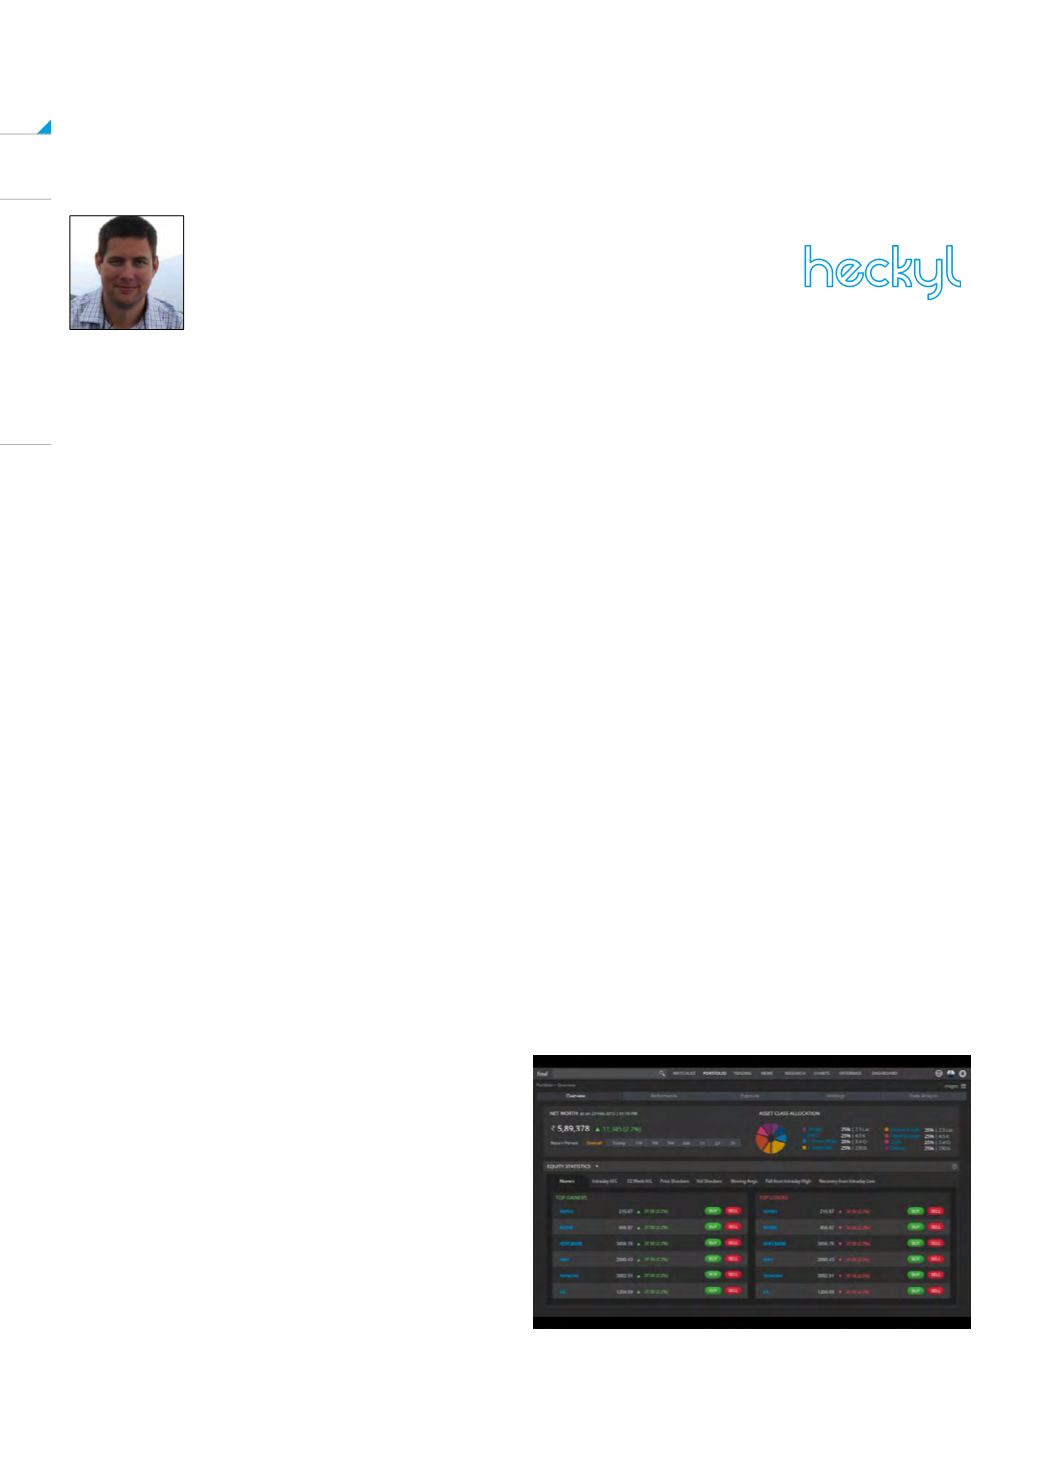
The system provides a number of views, providing key
details and analysis for the retail trader. The summary
screen offers a high level view of the users’ portfolio,
including asset allocation and top gainers and losers.
The performance view provides the key metrics to
help users understand their trading style. The system
analyses the users past and current trading to provide
a ranking with regard to:
•
Risk management
•
Trading performance
•
Experience
•
Timing
The charting allows a user to review their trading
performance over various timeframes, as well as
filtering based on realised and unrealised gains. An
overview is also provided of the users’ performance
over the last year along with their risk characteristics.
The portfolio holdings screen allows users to see their
entire holdings, with key metrics, as well as grouping
holdings based on sectors or market cap, also allowing
them to filter and analyse their holdings based on
personal parameters.
Fig 1 – Portfolio Holdings Screen


