DIY Investor Magazine
/
December 2015
13
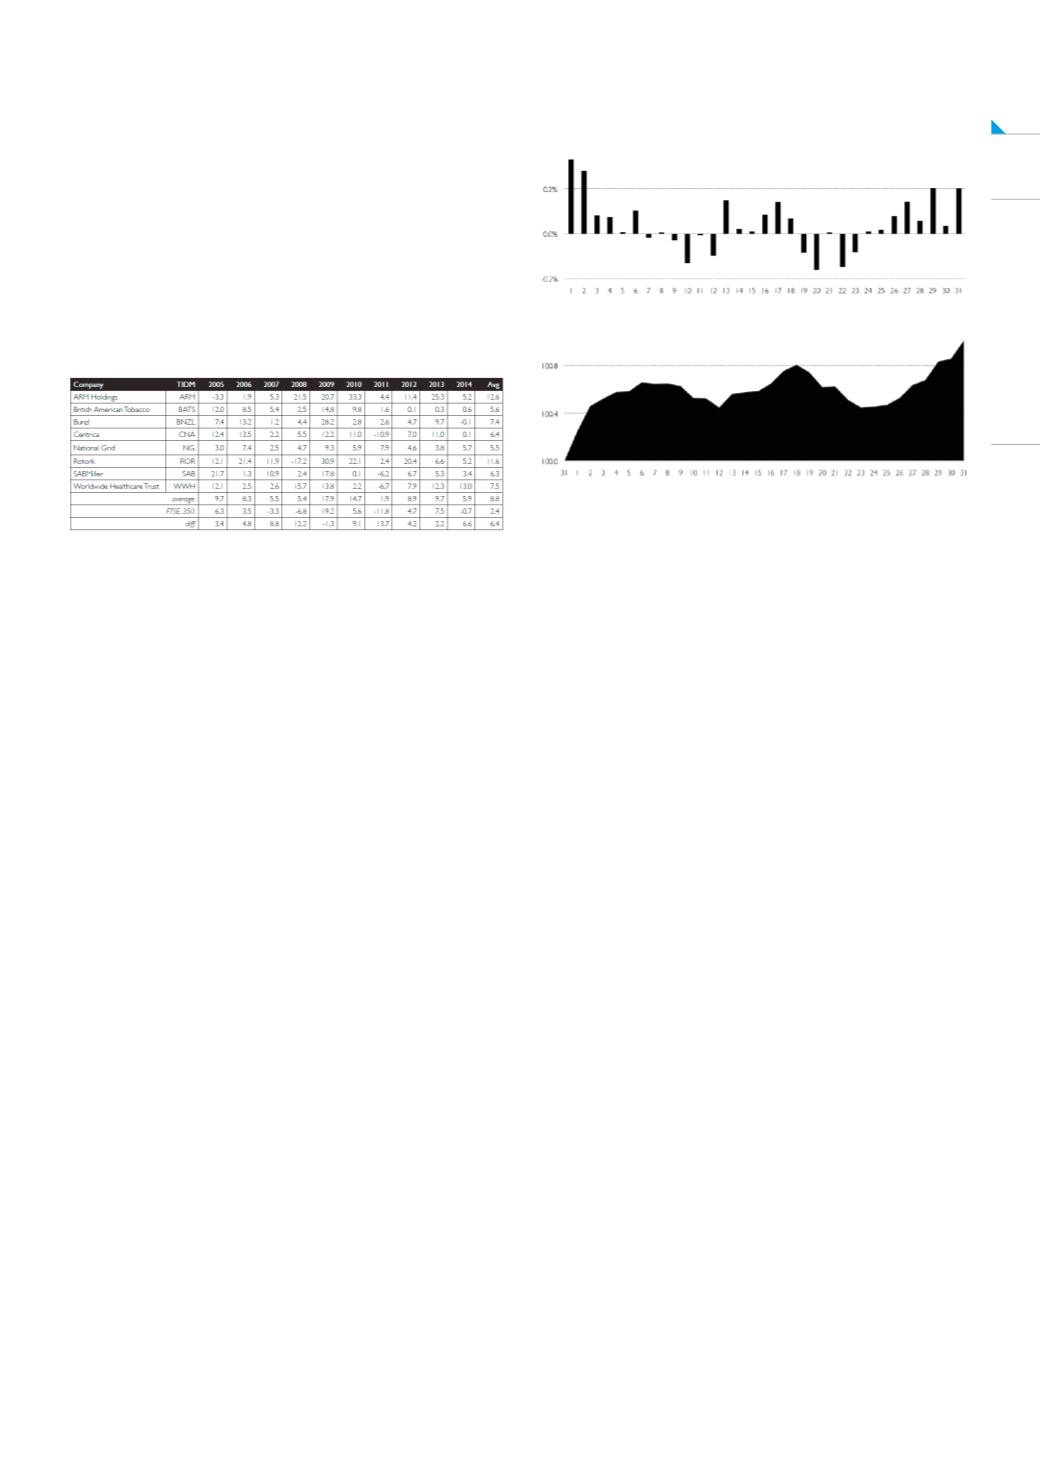
SUMMER SHARE PORTFOLIO
Avoiding debate around whether Summer should
be defined according to the astronomical or
meteorological calendar, for the sake of this
analysis the performance of the FTSE 350 was
monitored for the ten years between 2005 and
2014 from the summer solstice (June 21st) until the
autumn equinox (September 22nd)
On average over the last ten years, the market
has risen 2.4% over the summer, but an equally-
weighted portfolio of these eight stocks rose an
average of 8.8% in each summer.
An equally-weighted portfolio of these eight
companies would have outperformed the FTSE
350 in nine of the past ten years; the average out
performance each year would have been 6.4%
percentage points.
In the last ten years there are no stocks that have
consistently underperformed the market in the
summer.
AN AVERAGE MONTH
What does an average month for the FTSE 100
look like? The Almanac has charts that show the
average cumulative behaviour of the market by
calculating the daily mean return for each day
in the trading year from 1984. They then show
the average behaviour of the market for the 12
calendar months for each day of the month, and
the average behaviour of the market on each day
in any month.
The following chart plots the average daily returns
for each day in the month for the FTSE 100 over
the period 1984-2015.
For example, since 1984 the market has traded
236 times on the first calendar day of all the
months, and the average return of the FTSE 100
on those 236 days has been 0.25% (the first data
point plotted in the chart).
From this data the average cumulative
performance of the FTSE 100 in a month is
presented based on each day’s average gain/loss:
So, in an average month the FTSE 100 rises to
the 5th of the month, then falls back until the 12th.
It then increases again briefly to the 18th, before
falling back and then finally bottoming on the 23rd,
then rising quite strongly from there to the end of
the month. A rather remarkable fact is that 76% of
all the index gains in a month come from the first
and last six days of the month.
Some other trends that are identified indicated that
around the Turn of the Month - analysis since 1970
shows a clear pattern whereby five days before the
end of the month performance is weak (-0.03%)
but then rallies three days before the end of the
month before falling away again. Markets then start
the new month strongly - since 2000 the market
has risen on 64% of the first days in a new month,
with an average change of 0.28% (nine times the
average change on all trading days).
This is a book that may have you scratching your
head in search of a rational explanation for what is
presented, but one thing is for sure, you’ll return to
it again and again as 2016 unfolds.
TO PURCHASE THIS BOOK FOR THE SPECIAL
DIY INVESTOR PRICE OF £18 + P&P (RRP £25)
USE THE FOLLOWING PROMOTIONAL CODE
WHEN CHECKING OUT AT THE HARRIMAN
HOUSE ONLINE BOOKSHOP: DIYEE15


