DIY Investor Magazine
|
June 2017
46
JULY MARKET
SEASONALITY EFFECTS AND ANOMALIES
The latest edition of Stephen Eckett’s fascinating
reference book may have you scratching your
head in search of a rational explanation for what is
presented, but one thing is for sure, you’ll return to it
again and again as 2017 unfolds
THE UK STOCK MARKET ALMANAC 2017
MARKET PERFORMANCE THIS MONTH
Those selling in May can avoid the worst returns over
this period which occur in May and June; after June,
returns up to St Leger Day (in September) tend to be
quite flat, in fact prices quite often bounce back in July
– making this month a small island of strength in an
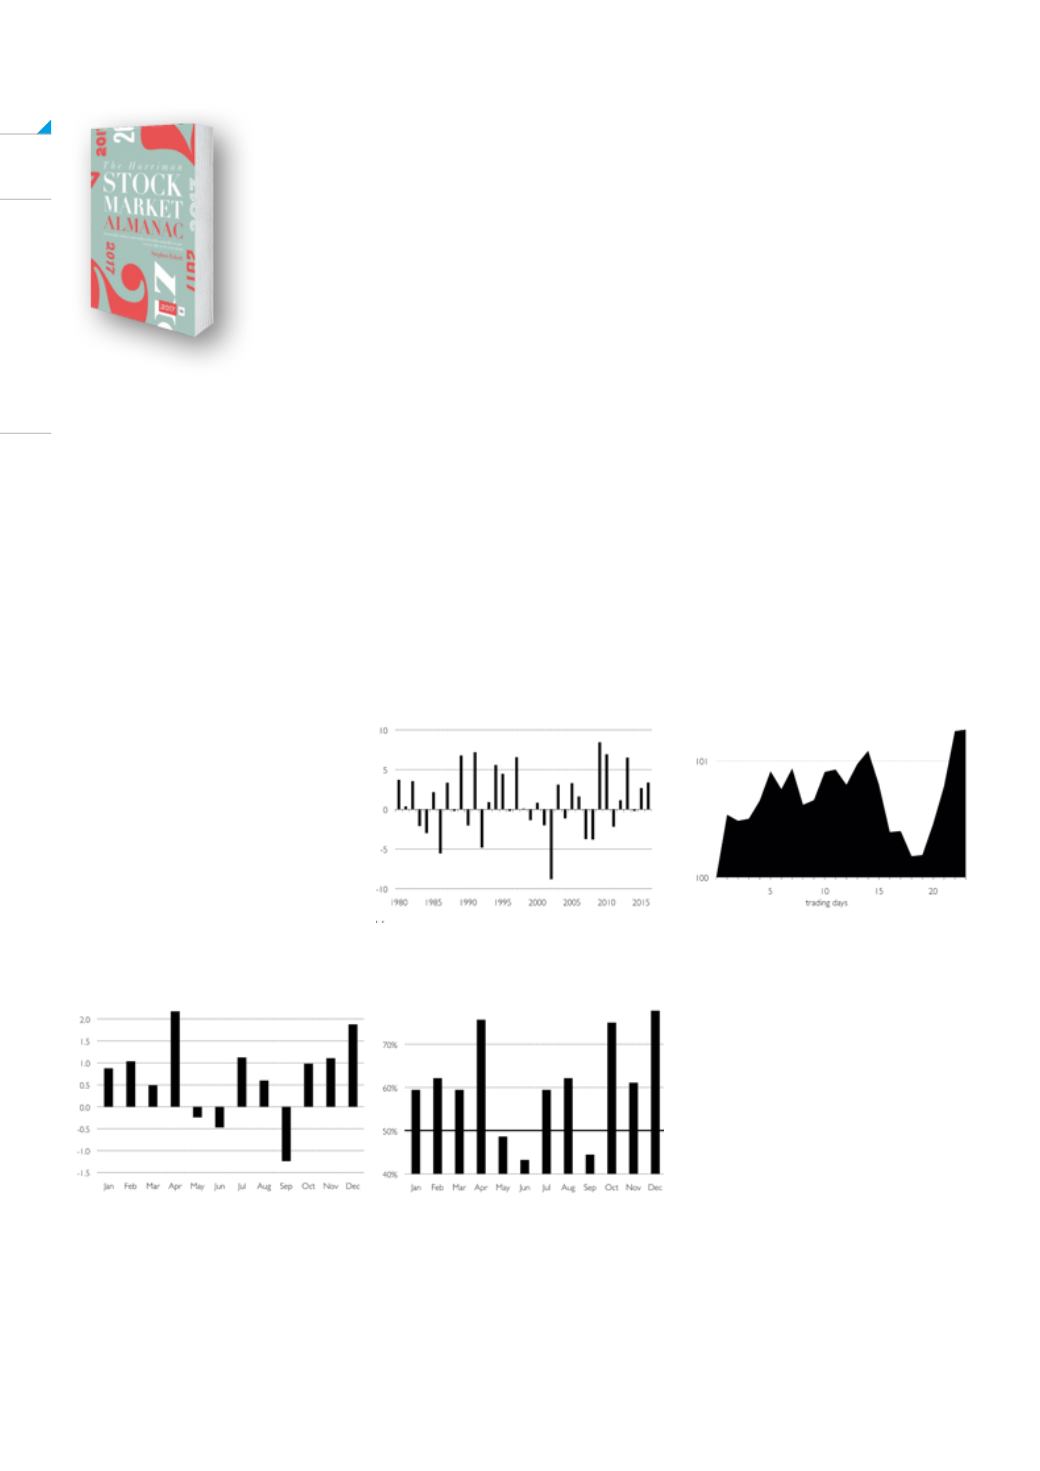
otherwise weak six-month period. Since 1984, the FTSE
100 has seen an average return of 1.0% in July, with
55% of years seeing positive returns making July the
fifth strongest month of the year for shares. The chart
shows that in recent years shares have been particularly
strong in this month returning over 6% in three of the
last seven years; the start of the month tends to be
strong – the first week of the month is among the top
ten strongest weeks in the year - then the market has
a propensity to drift lower for a couple of weeks before
finishing strongly in the final week of the month.
MONTHLY SEASONALITY OF
THE FTSE 100
The following charts show the
average monthly returns for the
index since 1984: the left chart
shows the average monthly
returns; the right plots the
proportion of years in which each
month had a positive return.
Since 1984 the strong months for
the FTSE 100 have been April,
October and December, and the
weak months have been May,
June and September; there is some
persistency in these observations
as the same profile of behaviour
can be seen for the recent period
2000-2016 (the only difference
being that January joined the list of weak months in the recent period).
To purchase this book for the special DIY Investor price of £18 + P&P (RRP £25) use the following promotional
code when checking out at the Harriman House online bookshop: DiYEE15.


