DIY Investor Magazine
/
2015 Issue
28
SENTIMENT
– THE NEXT STAGE OF SHARE ANALYSIS
A value investor invests in a stock after looking at
a number of factors such as the financials of the
company, analysing annual reports, news on the stock
and sector, reading the management outlook and
tracking the price movement.
However, one of the key challenges for investors and
even for traders is to track the sentiment around the
stock on a daily basis without missing any relevant
news.
However with there now being over 277,000 tweets,
571 websites created, 347 new blog posts and 72 hours
of new video being added to YouTube every minute
of every day, the volume of data to read and filter is
growing exponentially.
In today’s world, things change very rapidly and what
looked to be a multibagger two months ago can turn
into a disastrous investment, if the relevant news and
sentiment around the stock is not tracked regularly.
Trading is all about the timely entry and exit in a stock.
A gap between perception and actual reality can offer
traders and investors a profitable trading opportunity
using sentiment analysis across various asset classes.
Sentiment tools allow a user to measure the sentiment
of a particular news item or news flow around an
instrument and evaluate its potential impact, in real-
time. Let us take a look at the Stock Sentiment graph
below and how you can effectively use it as a precursor
to stock price movement.
Apple, the world’s most valuable listed company has
huge traction globally as one of the most renowned
brands amongst consumers, on both mainstream and
social media. Let us take a case study of Apple’s price
movement compared to its sentiment graph.
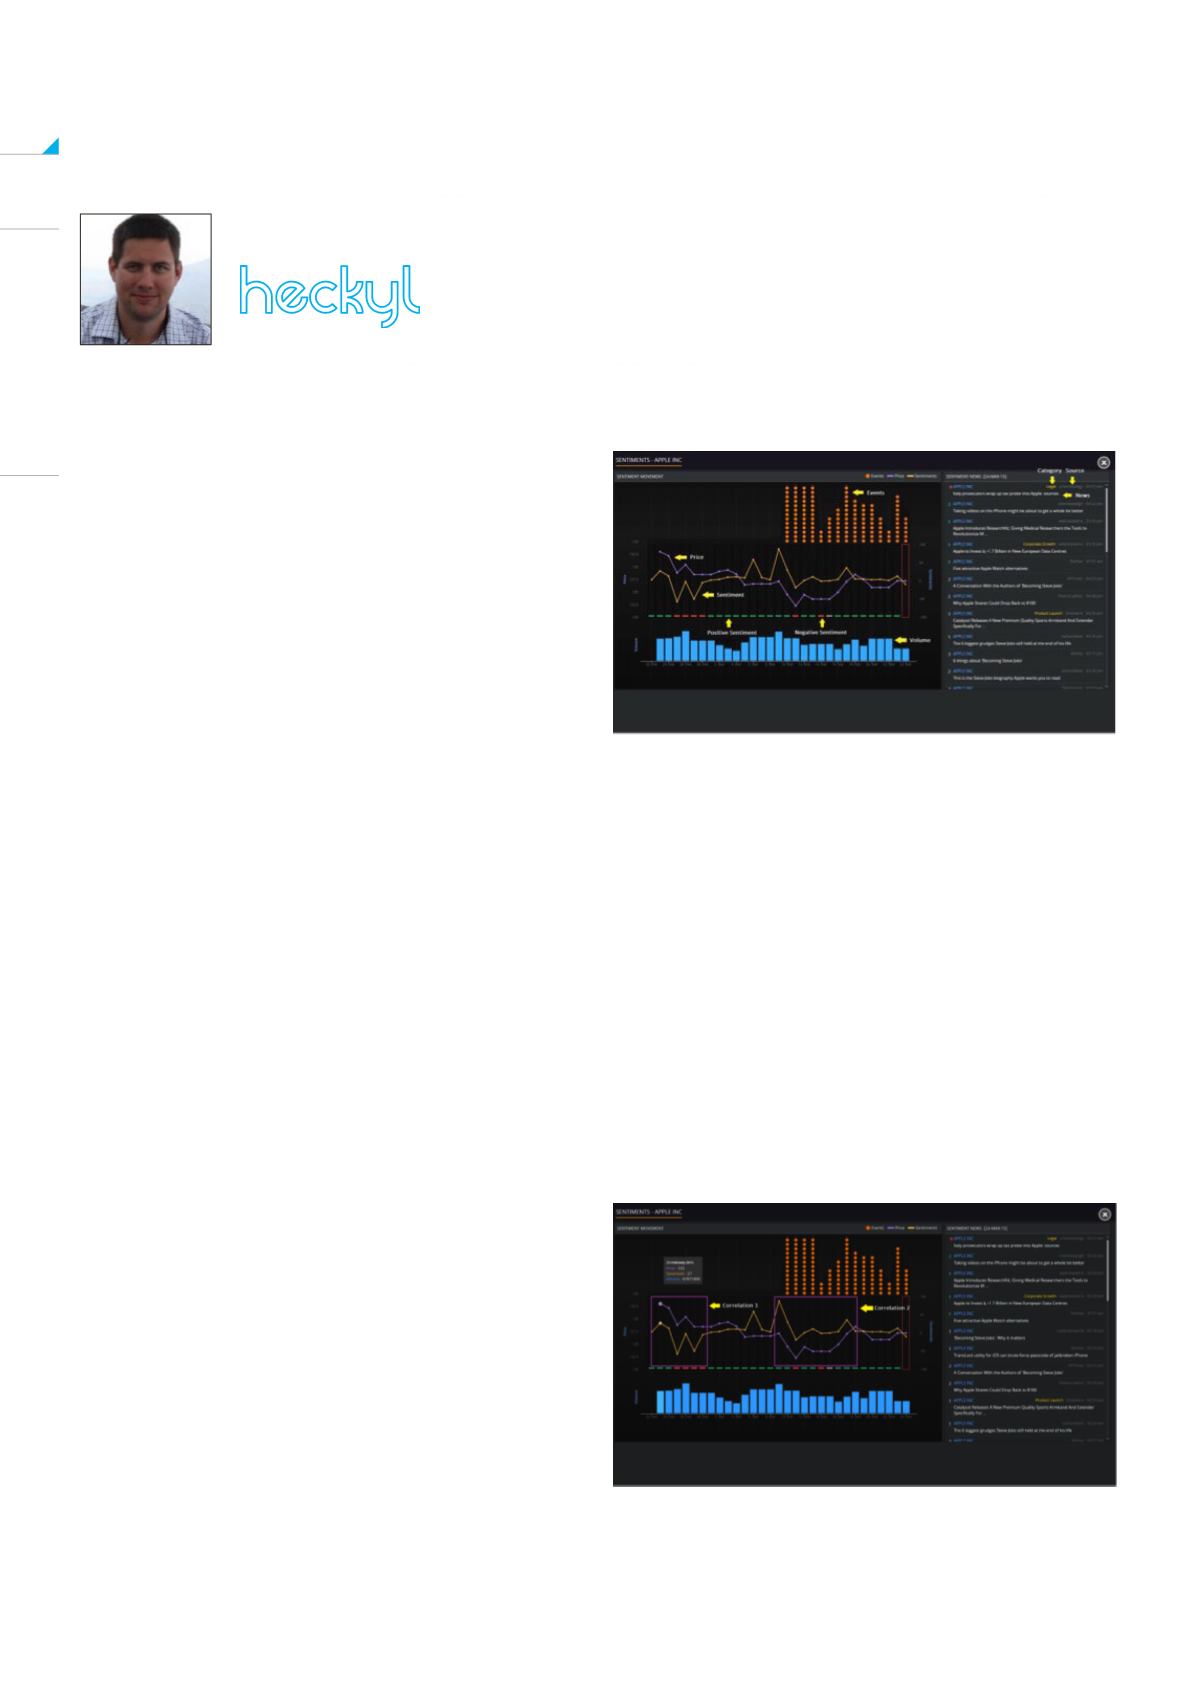
How to view Stock Sentiment Graph
The purple dotted line denotes the share price
movement while the yellow dotted line indicates
the sentiment score movement on a scale of -100
(extremely negative) to 100 (extremely positive) with
zero as neutral, both displayed on an end of day basis.
The orange circles represent the events that took place
on a particular day on which the sentiment score was
calculated.
Under the price and sentiment graphs a green dash
means the sentiment was generally positive for the day,
while a red dash suggests negative sentiment. The blue
bars indicate news message volume on that particular
day.
Gustav Pegers Head of Sales


