
Page 51 - DIY Investor Magazine | Issue 38
P. 51
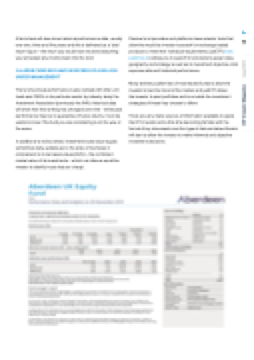
 A fact sheet will also show historical performance data, usually over one, three and five years and this is delivered as a ‘total return’ figure – the return you would have received assuming you reinvested any income back into the fund.
‘A LARGE FUND MAY HAVE IN EXCESS OF A BILLION UNDER MANAGEMENT’
The fund’s annual performance is also ranked with other unit trusts and OEICs in its particular sector by industry body the Investment Association (previously the IMA); historical data will show how this ranking has changed over time – whilst past performance may be no guarantee of future returns, it can be useful to know if the fund you are considering is on the wax or the wane.
In additional to its fact sheet, investment trusts issue regular, sometimes daily, updates as to the price of its shares in comparison to its net asset values (NAV) – the combined market value of its investments – which can allow a would be investor to identify trusts that are ‘cheap’.
Passive fund providers and platforms have selector tools that allow the would-be investor to search for exchange traded products to meet their individual requirements; justETF (www. justetf.co.uk) allows you to search for products by asset class, geography and strategy as well as its investment objective, total expense ratio and historical performance.
Many brokers publish lists of most traded funds to allow the investor to feel the mood of the market and justETF allows the investor to post portfolios and to emulate the investment strategies of those they choose to follow.
There are very many sources of information available to assist the DIY investor and a little time becoming familiar with the format of key documents and the type of data contained therein will start to allow the investor to make informed and objective investment decisions.
51
Aug 2023
DIY Investor Magazine ·
